AI SEARCH VISIBILITY
KPIS
Which numbers tell you whether ChatGPT, Gemini, and Perplexity are naming your brand, which ones are noise dressed up as a dashboard, and how to get from a visibility percentage to a figure a CFO will accept.
This is the reporting framework. If you want the plain definitions first, read AI visibility metrics and KPIs, or run CITED's free AI visibility check to get your own numbers to put in it.

What are AI search visibility KPIs?
AI search visibility KPIs measure whether AI assistants name your brand when buyers ask for recommendations, and whether that turns into revenue. Four measure the visibility itself: visibility score, share of voice, position, and citation rate. Two connect it to the business: self-reported attribution and pipeline contribution. Referral traffic from AI is the weakest of the six, because most AI answers never produce a click at all.
Why your analytics cannot see AI search
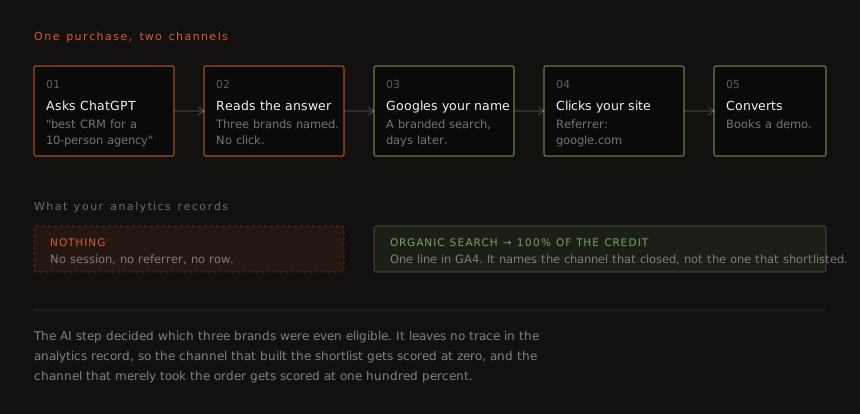
The reason AI visibility needs its own KPIs is not that marketers enjoy new dashboards. It is that the decisive step in an AI-influenced purchase leaves no record in your analytics at all.
A buyer asks an assistant which tools to consider. The answer names three brands. The buyer reads it, closes the tab, and a few days later types one of those three brand names into Google. They click through, they convert, and your analytics files the whole thing under organic search.
That report is not wrong, exactly. The branded search really was the last click. But the AI answer decided which three brands were eligible to be searched for, and it gets scored at zero, because there is nothing to score: no session, no referrer, no row in the table.
So the first rule of measuring AI search is that the primary KPI cannot be traffic. It has to be the thing that happens before the traffic: whether you are in the answer.
Six KPIs, ordered from cause to effect
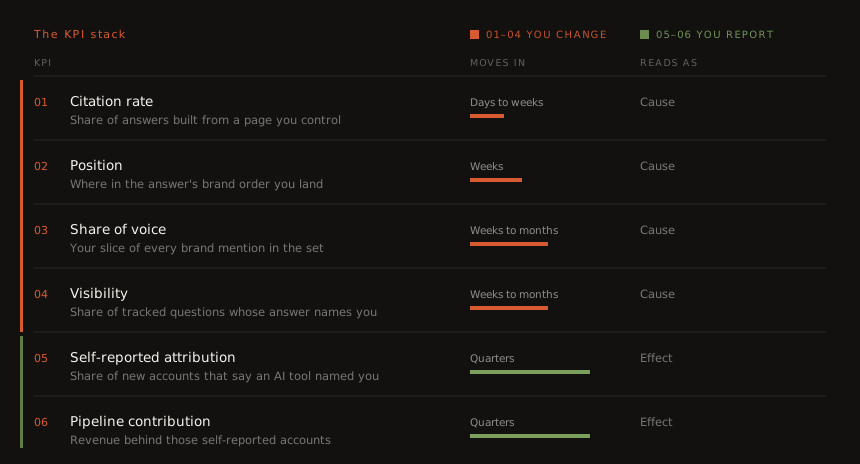
Most AI visibility reporting fails in the same way: it puts six numbers on one screen with no statement of which ones cause the others. Then visibility moves, revenue does not, and nobody can say whether that is a failure or a lag.
Order them instead. The first four are levers you pull, and they move in days to months. The last two are outcomes you report, and they move in quarters. When the top of the stack is flat and the bottom is climbing, you are early, not wrong.
| KPI | The question it answers | Where the number comes from |
|---|---|---|
| Visibility | Of the buyer questions you track, how many answers name you at all? | Your own prompt set, re-asked on a fixed schedule |
| Share of voice | Of every brand named across those answers, what share is you? | The same answers, counting rivals as well as yourself |
| Position | When you are named, do you come first or fourth? | The order the brands appear in the answer text |
| Citation rate | Which pages did the assistant actually build the answer from? | The grounding sources attached to each answer |
| Self-reported attribution | What share of new customers say an AI tool put you on their list? | A required field on your signup or demo form |
| Pipeline contribution | What is that cohort worth? | Your CRM, filtered to the customers who self-reported |
Visibility: how often you get named at all
Visibility is the share of your tracked buyer questions whose answer names your brand. Ask ten questions, get named in four, and your visibility is 40%. It is the baseline every other number is read against.
The number is only as good as its denominator, and this is where most tracking goes wrong. The prompt set has to be fixed, written in the language buyers actually use, and re-asked unchanged on a schedule. Add three easy questions in month two and your visibility will rise without anything about your brand having changed.
The second discipline is coverage. Run the prompt set against each engine separately and report them separately, because they disagree: what ChatGPT, Gemini, Perplexity and Google AI Overviews name for the same question is often three different shortlists, and a single blended number hides the one engine you are losing. The third is statistical. Large language models are non-deterministic: the same question asked twice can name different brands, so a single prompt is not a keyword and cannot be tracked like one. What is stable is the aggregate. Ten questions asked daily give you a visibility trend you can trust long before any individual question settles down.
CITED scores this as a 0 to 100 visibility number on a prompt set frozen at setup, re-asked on every check so the time series stays comparable. If a check fails, nothing is written: an API error is never allowed to record itself as a miss, because a fake data point is worse than a gap.
Share of voice: whose conversation is it
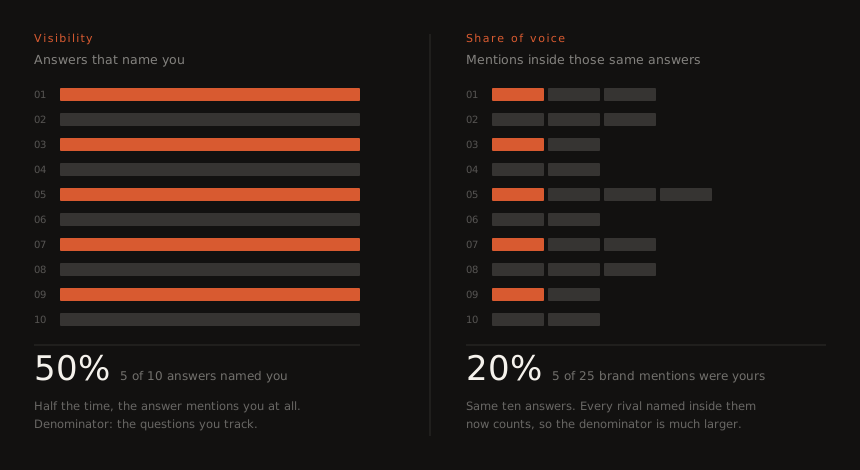
Visibility asks whether you were in the answer. Share of voice asks how much of the answer was you. They are computed from exactly the same set of answers and they routinely disagree, which is the entire reason to track both.
The example below shows a brand with a healthy-looking 50% visibility and a 20% share of voice. It is named in half the answers, but the answers that name it also name three or four rivals each, so it owns a fifth of the conversation. That is a completely different competitive position from a brand at 50% visibility whose answers name nobody else.
The divergence is the signal
Watch for the case where visibility holds steady and share of voice falls. That means the assistant still names you as often as it did, but it is now naming more competitors alongside you. Your position has not weakened; the category has got more crowded. The response to that is competitive, not technical, and you would never see it from a visibility number alone.
The reverse pattern, share of voice rising while visibility is flat, usually means rivals are dropping out of answers you were already winning. That is worth knowing before you spend a quarter congratulating yourself for it.
Because share of voice is computed against the competitors named in your own answers, it also produces the competitor list for free. You do not have to guess who you are up against in AI search: the answers tell you, and the set changes over time.
Position: named first or named last
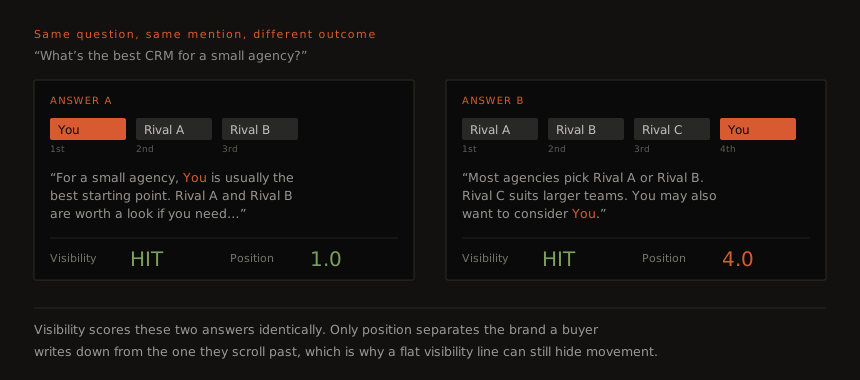
A mention at the top of an answer and a mention in the final clause both score as a hit. Buyers do not read them the same way. Position measures where in the answer's brand order you land, with 1 meaning named first.
This is the metric that explains a flat visibility line that somehow feels like progress. You can spend a quarter moving from fourth mention to first across your whole prompt set, gain nothing on visibility, and materially change how many buyers write your name down.
Citation rate: which pages the answer was built from
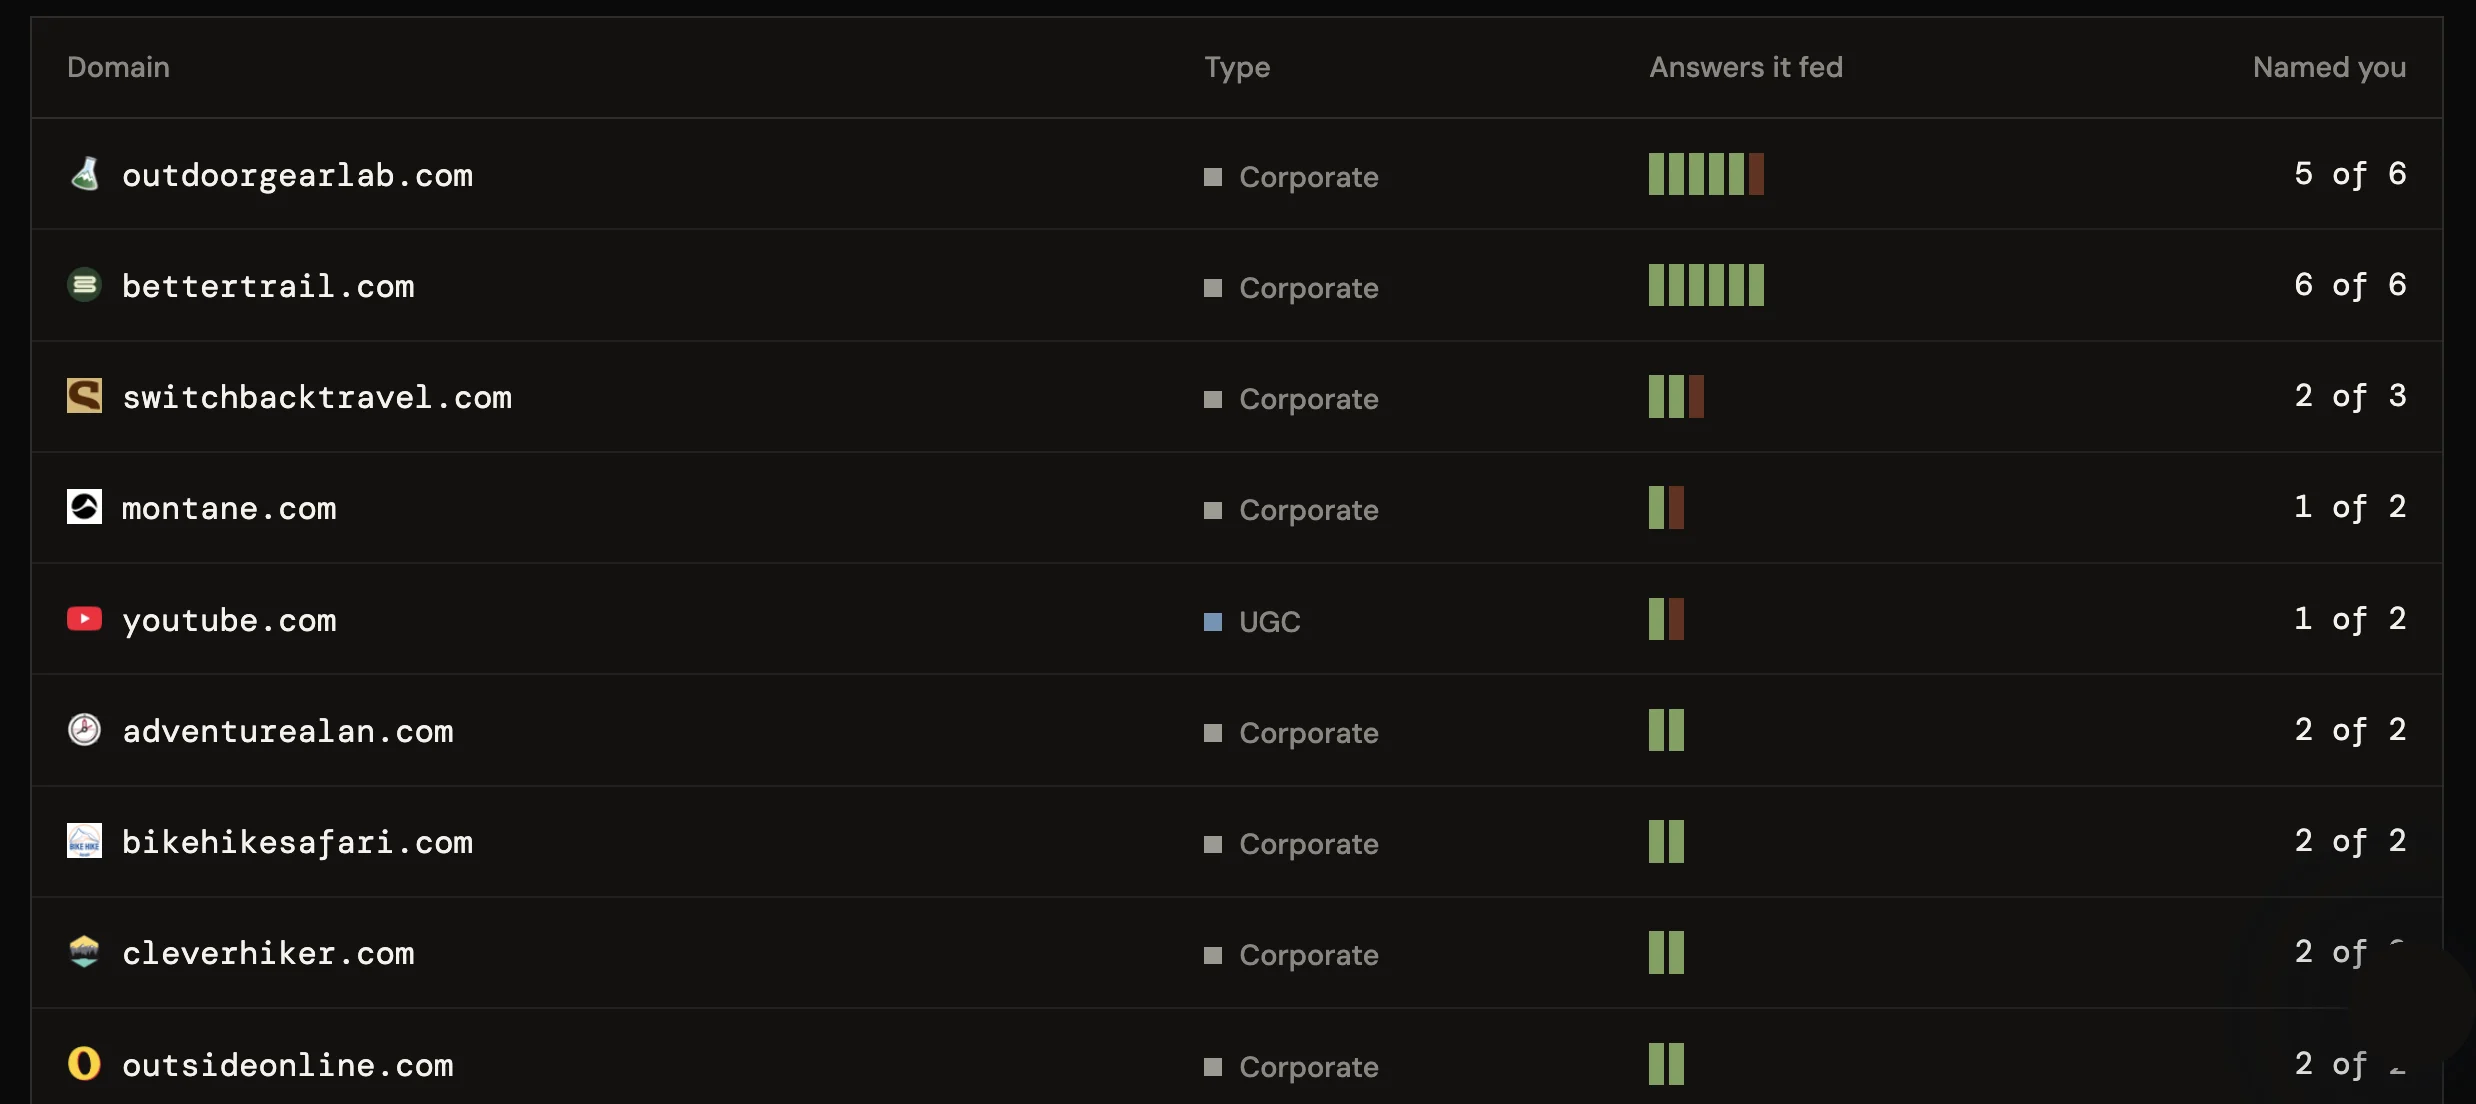
Citation rate is the share of answers whose grounding sources include a page you control. It is the earliest-moving KPI in the stack, and the most directly actionable, because it names specific URLs rather than describing a general condition.
Read it as a win and loss split per domain rather than a single percentage. Every site the assistant reads is feeding some answers that name you and some that do not, and the ratio tells you what to do next. A site behind six answers that named you five times is already working. A site behind six answers that named you once is the highest-value page on your to-do list, because the assistant is clearly reading it and clearly not finding you there.
That split also separates the two kinds of work. Pages on your own domain are a content problem you can fix this week, and the mechanics differ by surface: AI Overviews and AI Mode lean far harder on pages that already rank in Google than ChatGPT does. Third-party pages, review roundups, comparison posts, community threads, are an outreach problem, and they are usually where the larger share of the losses sits.
Always yours, contested, never yours
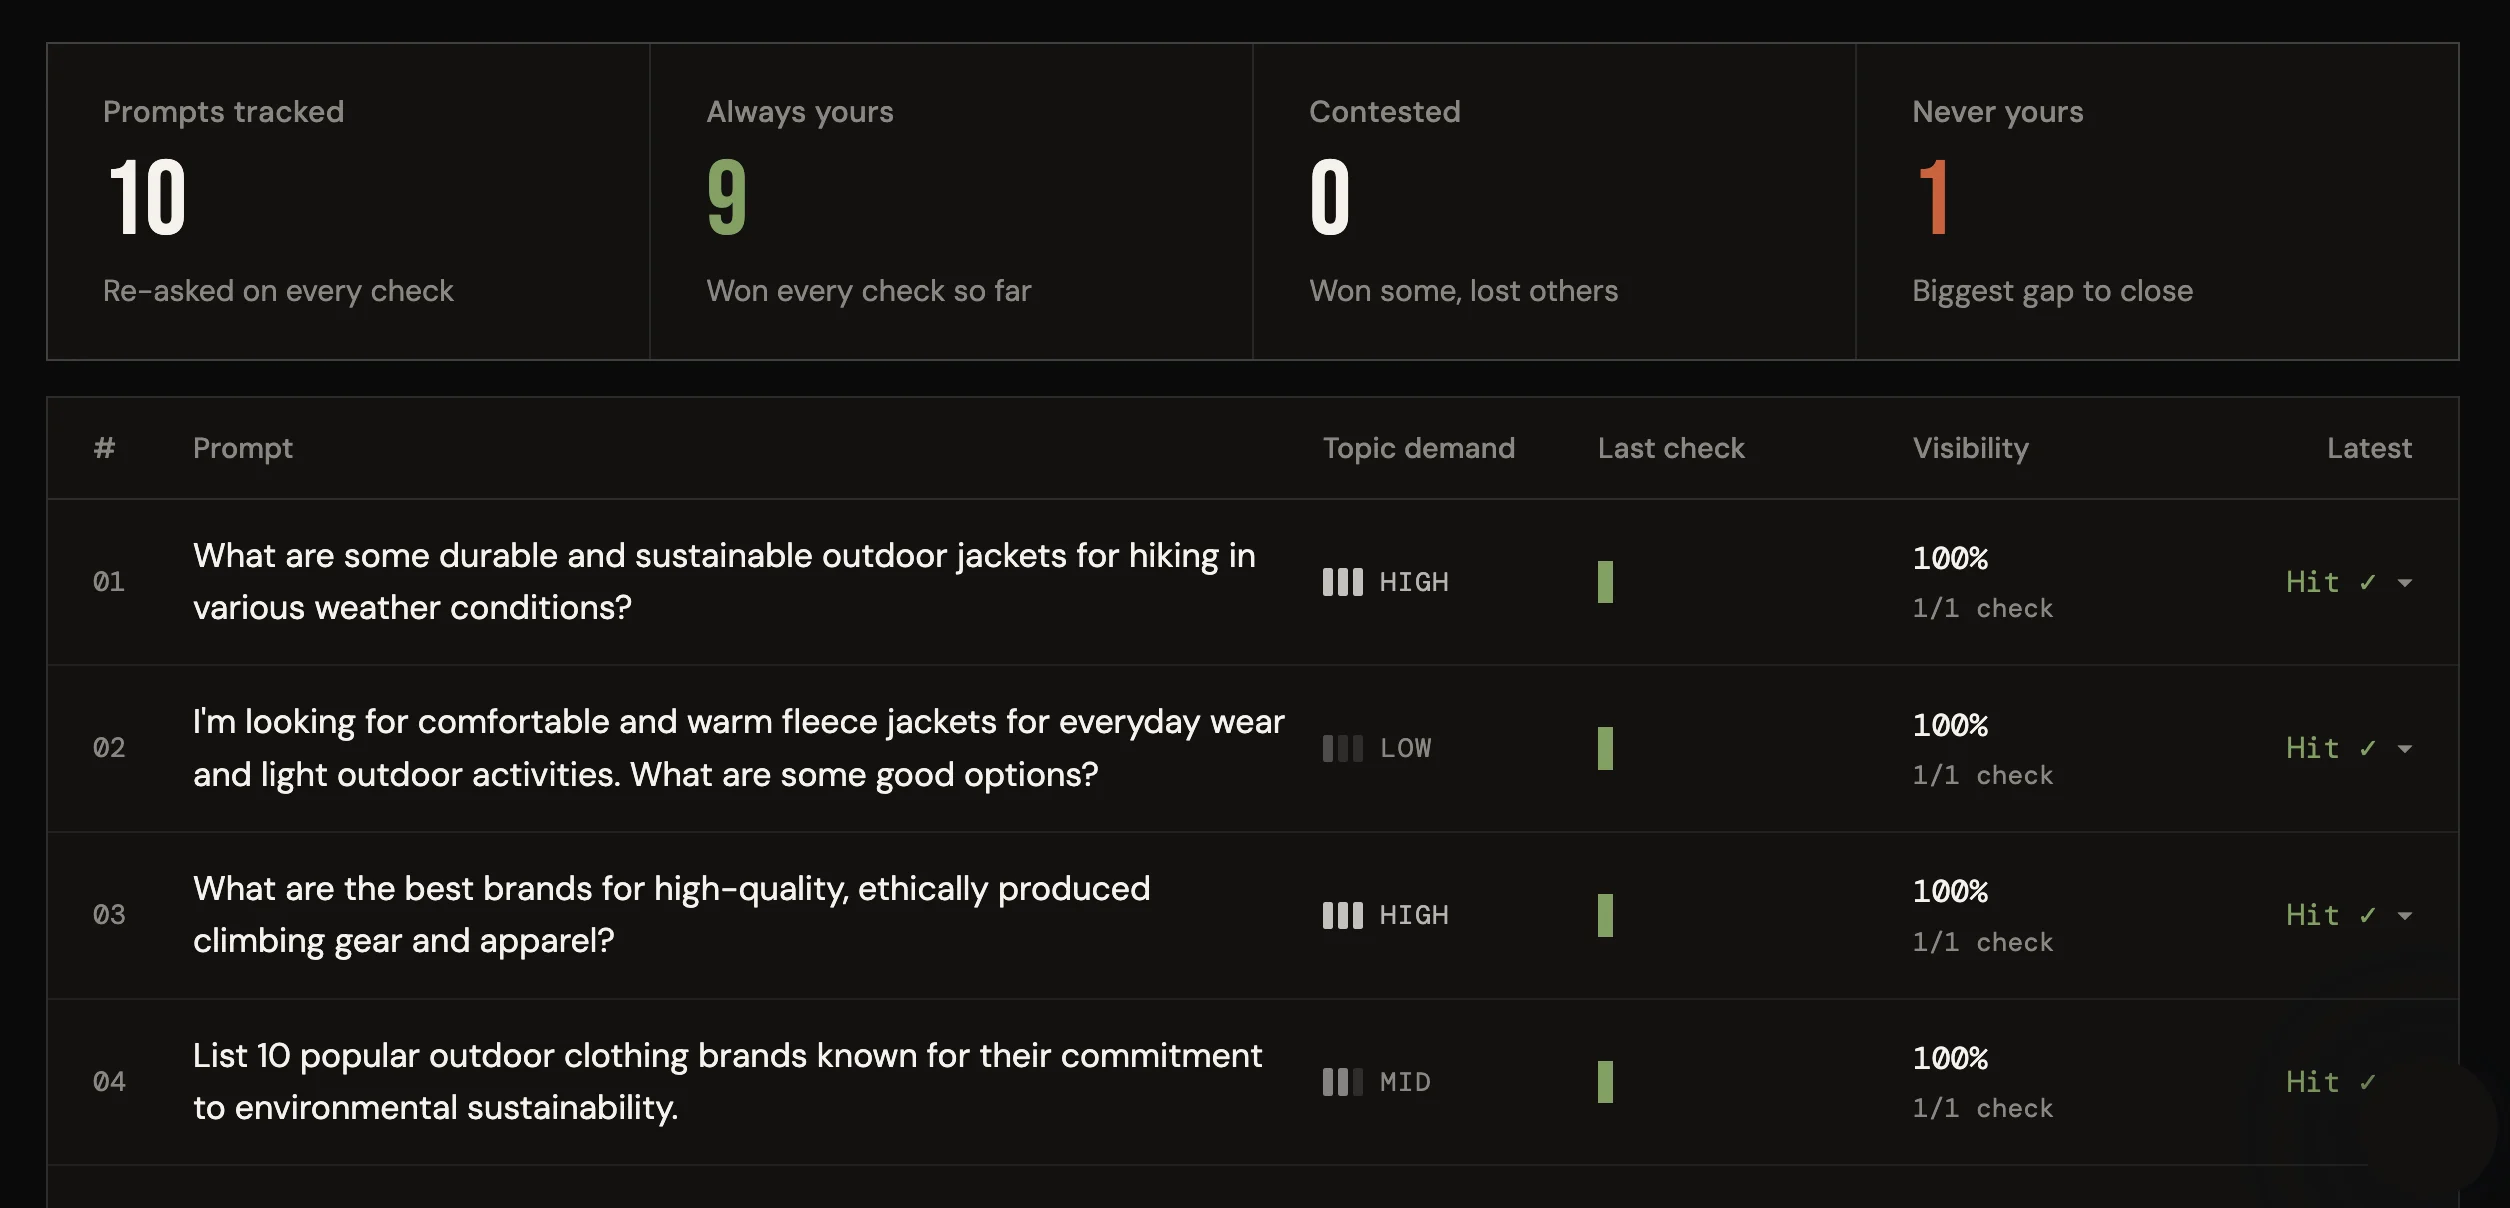
Aggregate visibility tells you where you stand. It does not tell you what to do on Monday. For that, split every tracked question into three buckets: the ones you win every time, the ones you lose every time, and the ones you win sometimes.
The contested bucket is where the cheapest wins are. A question you already win half the time is one good citation away from winning outright, and the assistant has already demonstrated it is willing to name you there. A question you have never won may need a year of brand building first.
One bucket deserves its own alarm: branded questions you lose. If someone asks about your product by name and the answer does not name you, that is not a competitive problem, it is a retrieval problem, and it is usually fixable with content and crawler access rather than with reputation.
Order the buckets by your own commercial weight. Not every tracked question is worth the same to you, and no tool can tell you which ones are: nobody sells a reliable count of how often people ask an AI a given question, and the keyword volumes that do exist decay to zero as a phrase gets longer, so a full question measures nothing. Rank the contested and never-yours questions by the deal size behind them and work down that list, rather than waiting for a number that does not exist.
How to connect AI visibility to revenue
There is no clean attribution path from an AI answer to a closed deal, and any tool that claims otherwise is selling you a number it cannot support. What exists is three imperfect methods, each of which proves something different. Run all three and the gaps in one are covered by the others.
| Method | What it proves | What it cannot tell you |
|---|---|---|
| Self-reported attribution | A named buyer says an AI assistant put you on their shortlist. The only direct evidence of AI influence that exists. | Recall is imperfect, and the option has to be on the form before the quarter starts. It cannot be backfilled. |
| AI referral traffic and conversions | Hard revenue from sessions with an AI referrer, measurable today in the analytics you already run. | It only sees the minority who clicked, so it is a floor, never a total. |
| Branded demand lift | Branded search volume and direct traffic rising in step with your visibility trend. | Correlation only. Everything else you shipped that quarter moves the same lines. |
Do the arithmetic, then label it honestly
Self-reported attribution is the one to set up first, because it is the only method that captures influence regardless of which channel took the last click, and because it costs one optional field on your signup form. Ask how people heard about you, put ChatGPT, Gemini, Perplexity, or Claude in the list as named options rather than burying them under other, and count the answers.
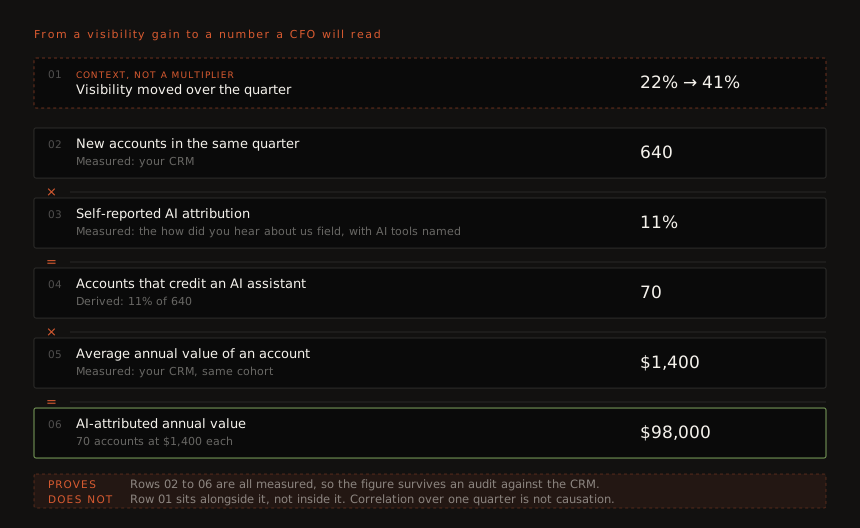
Once you have a self-reported rate, the revenue figure is a short arithmetic chain, and the discipline that makes it survive scrutiny is keeping estimates out of it. Count the accounts, apply the self-reported rate, multiply by the value your CRM already holds. Every step is measured, so the output can be checked against the CRM by anyone who doubts it.
Note what the worked example below does not do. It does not multiply the visibility gain by an assumed question volume to forecast the revenue. That calculation is tempting, it produces a bigger number, and it is where this kind of reporting usually falls apart, because two invented inputs at the top become one unfalsifiable figure at the bottom. Keep the visibility movement next to the revenue as context, not inside it as a multiplier.
Say what the number does not carry
The figure that chain produces is real revenue from real accounts, and it will hold up if someone opens the CRM. What it does not carry is causation. Those customers said an AI assistant named you; they did not say it was your visibility work that put you there, and over a single quarter you cannot separate that from a launch, a review that landed well, or a competitor stumbling.
So report the two things side by side and let the relationship build over time. Visibility moved from 22% to 41%, and AI-attributed value in the same period was $98,000. After three or four quarters the shape of the relationship becomes an argument. After one quarter it is a coincidence with good manners.
This matters more than it sounds. The fastest way to lose executive trust in AI search reporting is to present a modelled number as if it were measured, have someone check it against the CRM, and find no such line item. A figure you can defend survives that conversation. A bigger one you cannot does not.
It is also worth being blunt about the published benchmarks in this area. Ahrefs reported AI referrals converting roughly 23 times better than organic for its own SaaS signups; a Visibility Labs study across 94 ecommerce brands found ChatGPT referrals converting at 1.81% against 1.39% for non-brand organic, a difference of about 1.3 times. Both are real measurements of very different businesses. A spread that wide across published studies is not a finding, it is a warning that most of these numbers come from self-selected samples at marketing and technology companies. Use your own baseline rather than anyone else's benchmark.
Why we do not publish a sentiment score
Most AI visibility tools ship a sentiment column. CITED does not, and the reason is worth stating plainly rather than hiding behind a roadmap.
Scoring tone means asking a model to rate another model's prose on a scale, and the result is not stable enough to trend. Small rewordings move it, the scale has no external calibration, and a number that wobbles for no reason is worse than an empty column, because people act on it.
What we do instead is keep the answer text. If you want to know how an assistant characterises your brand, the honest artefact is the sentence it wrote, not a 6.4 out of 10 derived from it. That is also the version you can paste into a deck, hand to a copywriter, or use to find the source page that produced the framing.
If you do want to track sentiment as a KPI, treat it as a periodic manual read of the actual answers rather than a daily automated score, and be sceptical of any tool that will not show you the text behind the number. Most of the AI visibility tools on the market ship a sentiment column, and it is worth asking each of them what theirs is computed from.
Four numbers that look like KPIs and are not
Each of these appears on real dashboards, and each one will eventually be used to justify a decision it cannot support.
AI referral traffic as the headline number
Worth tracking, never worth leading with. AI search products are reported to resolve somewhere between 60% and 93% of queries with no click at all, so referral traffic measures the small minority who clicked, not the majority who decided. Report it as a floor on AI impact, clearly labelled.
A single prompt, tracked like a keyword
Models are non-deterministic, so one question re-asked on Tuesday can give a different brand list than it gave on Monday. The daily movement of any individual prompt is mostly noise. Track the aggregate across a fixed set, and use individual prompts to investigate, not to report.
A global AI visibility score with no prompt set behind it
If a tool gives you one number for your brand without telling you which questions produced it, you cannot audit it, you cannot compare it to a competitor's, and you cannot tell whether a change came from your work or from the tool quietly changing its prompt list. Always ask what the denominator is.
Total mentions with no denominator
Mentions went up 40% is meaningless if the number of questions asked also went up. Every count in this space needs a denominator: answers naming you out of answers checked, your mentions out of all brand mentions. Raw counts only ever go in one direction.
A cadence that survives a board meeting
Different KPIs move at different speeds, so reporting them all on the same cycle guarantees that some of them are noise. Split the cadence to match the stack.
Weekly: work the contested bucket
Look at contested prompts and any branded questions you lost, and at which sites fed the answers that missed you. This is a working session, not a report. Nothing here goes to leadership.
Monthly: visibility, share of voice, position
Same prompt set, same engines, plotted as a trend rather than a snapshot. One chart, three lines, plus the competitor set so a change in the field is visible. Note anything you shipped that month next to the line.
Quarterly: the revenue bridge
Self-reported attribution rate, the cohort's pipeline value, and the modelled contribution as a range with its assumptions stated. A quarter is the shortest window in which the lagging half of the stack has had time to respond.
Once, at the start: freeze the prompt set
Write the questions your buyers actually ask, agree them with sales, and then leave them alone. Every later change to the list breaks comparability with everything measured before it. Add a second set if you need new coverage; do not edit the first.